Layer panel - Viewer layers
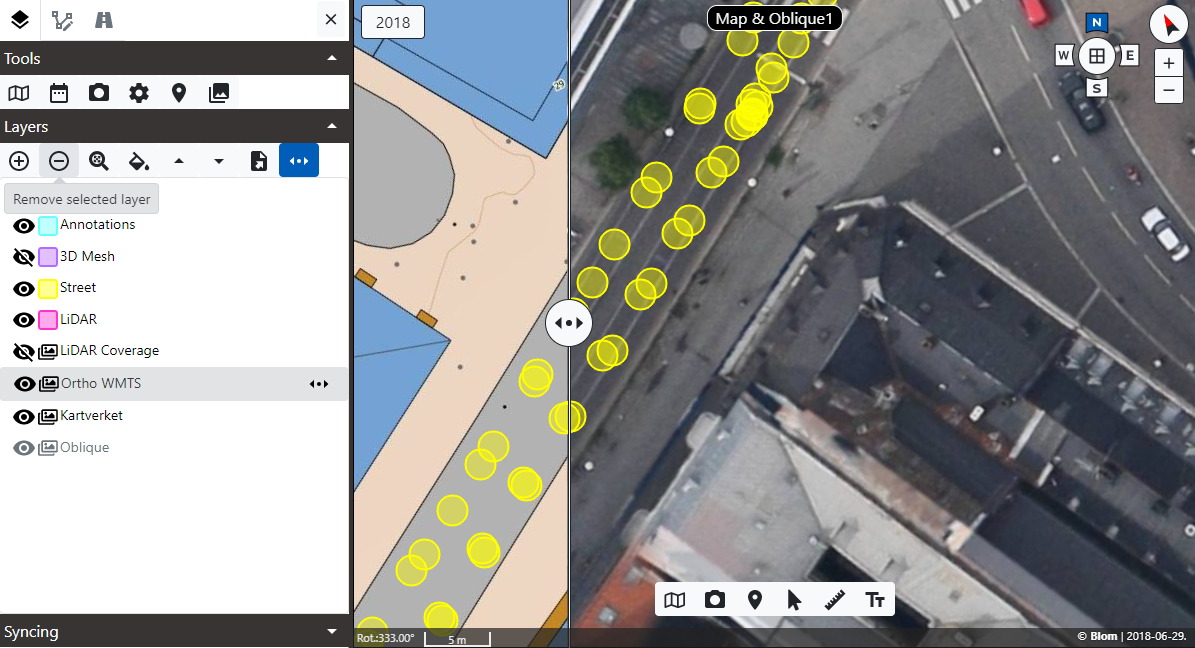
The Layers section of the Layer panel in the Toolbox allows the management of viewer layers.
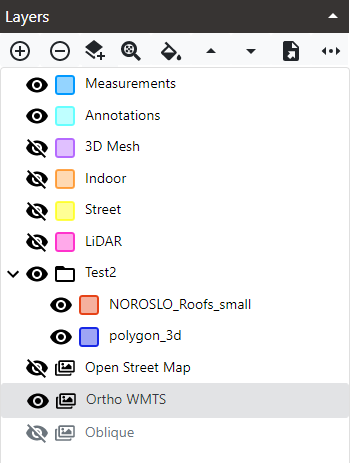
The control will show the loaded layers in priority order list (high visible priority in the top).
The Measurement and Annotation layers are always present and they can not be deleted.
Layers can be added in layer groups if they are created with the User Vector Layers functionality in the Dashboard.
These are the types of layers:
- Raster layers:
 Raster images with or without transparency.
 - Vector layers:
 Vector information. The icon will represent the layer style. Be aware that in some type of vector layers features can have a custom style. The icon in the layer list always represent the style for the whole layer.
 - LiDAR Project layers:
 LiDAR projects loaded as a unique layer.
 - 3D Mesh Project layers:
 3D Mesh projects loaded as a unique layer.
 - User vector layer groups:
 Groups of layers defined by the user in the Mapspace user account. The can be layer groups inside layer groups in different nested levels.
Change layer visibility
The layer visibility can be changed by clicking on the 'eye' icons. ![]()
![]()
When clicking in a layer group, all layers and layer groups below the one hidden will be hidden. When showing them again, layers and layer groups below will be shown in the same status as previously.
Alternatively when a layer is the Swipe layer an icon appears on the right of the layer name. Only one layer can be the Swipe layer at a time. ![]() Check more on Swipe layers below.
Check more on Swipe layers below.
Add a layer
To add a layer follow these steps:
-
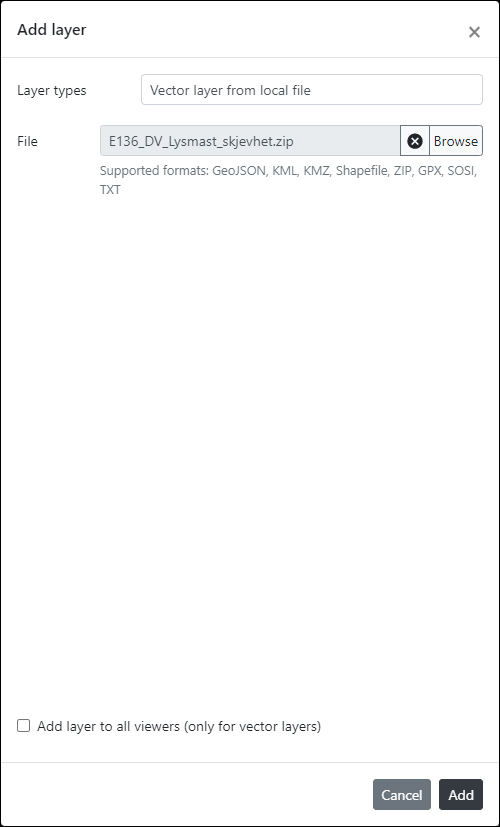
Click in the Add layer button.

-
The Add layer dialog opens.
-
Select any of the layer types availables. Some the layer types could be available only for users with given permissions.
-
Vector layer from Local file: to load local vector files in Kml/Kmz, GeoJson and Shapefile format. The Shapefile format must be loaded as a Zip file with all Shapefile files needed (shp, shx, dbf & prj) inside the zipped file. This option also allows to load several layers at once if the Zip file contains several Kml/Kmz, GeoJson and Shapefiles.
-
Vector layer from NVDB service: to load remote NVDB road objects. Check more info in NVDB layers
-
Vector layer groups from NVDB service: to load at once several NVDB road objects. Check more info in NVDB layers
-
WMS/WMTS layer: to load a OGC WMS/WMTS imagery service. It is necessary to type the URL to the 'GetCapabilities' service, then click in the Connect button for a first connection and the available WMS/WMTS layers will be displayed in 'Layers' selection box. Then select the desired layer. Only layers with the 'EPSG:3857' (Spherical Mercator) projection or equivalent are supported.
-
User raster layers: to load pre-defined UserLayers form Mapspace. Check more info in UserLayers. Select one or several UserLayers in the list of availables.
-
User vector layers / layer groups: to load pre-loaded vector layers or groups of them. Check more info in User Vector Layers.
-
-
To add the same layer to all viewers then check the Add layer to all viewers checkbox (if the layer is a vector layer) in the Add layer dialog. The layer will be added not only to current active viewer but also to the rest of viewers (no matter if they are visible or not). This has the advantage that the layer will be created with the same color styling in all viewers.
-
Click the Add button.
Note: Be aware that when adding the same layer to all viewers the layer is fully cloned, so each layer in each viewer has its own features. That means that when a feature is modified in one viewer the web app does not take care of these changes. There is one exception to this rule and it is layers with NVDB objects. Check more info in NVDB layers.
Note: When adding a vector layer from Local file, if that file is modified outsite the browser, the control in the browser that contains the name of the file can have a persisting reference to the old file and can block any attempt to add the same file again. To avoid it click in the Cancel file button next to the Browse file button to clear the control, and select the file again.
Remove a layer
To remove a layer follow these steps:
- Select the layer in the list.
- Click in the Remove layer button.

Some layers, as the Measurements, Annotations and other fixed layers cannot be deleted.
Add a layer to all viewers
The Layer panel has an option to add the selected layer in the Layers list to all the viewers. To do this follow these steps:
- Select a vector layer in the Layers list.
- Click in the Ensure selected layer is added to all viewers button.

- The selected layer will be searched in all viewers. If a viewer does not contain a similar layer to the one selected, then the layer is added, using the same style as current layer selected.
Zoom to the layer extent
To zoom a layer to its full extent follow these steps:
- Select the layer in the list.
- Click in the Zoom to full extent button.

Be aware that this tool calculates the extent of the given layer using the available information. If it is a vector layer, the extent will be that of the current loaded features. If it is a raster layer, the extent defined in the 'GetCapabilities' service, or if not found, the extent of the world.
Change the style for vector layers
To change the style of a vector layer follow these steps:
-
Select the layer to change clicking in it in the layer list.
-
Click in the Edit style button.

-
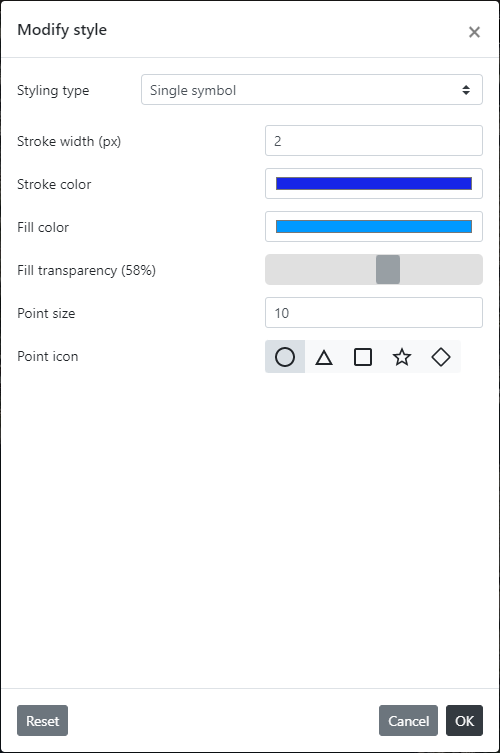
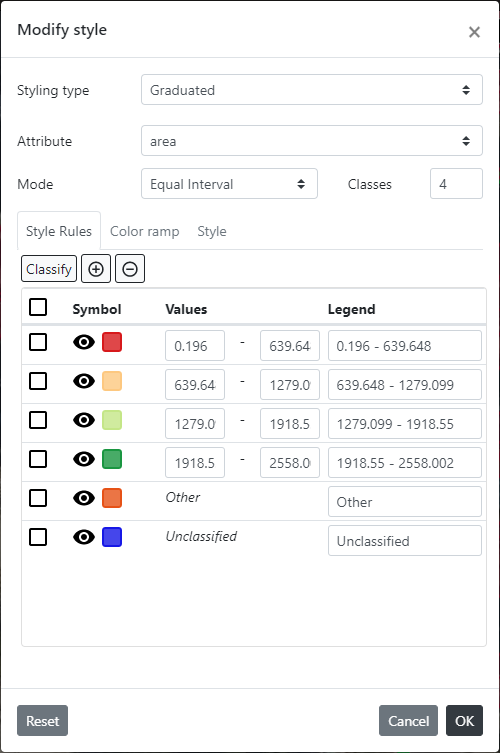
The Modify style dialog opens. For a vector layer the dialog has this appearence:
-
There are three main types of styling: Single symbol, for rendering all features with the same style; Categorized, for renderings with a list of styles, each one for a given value in features; Graduated, for rendereings with a list of style, each one for a given range of values. Select the Styling type to use.
-
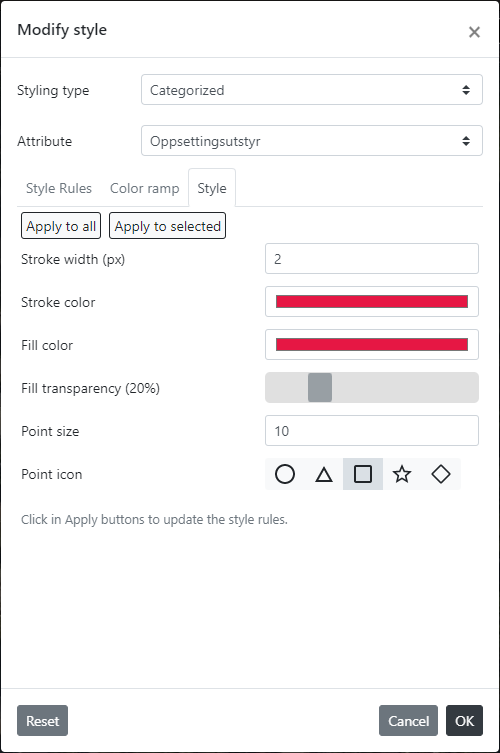
If Styling type is Single symbol select the width for edge lines (border of points, lines, or border of polygons) in the Stroke width selector, the color for the edge lines in the Stroke color selector (stroke color currently do not support a transparency) the color for filling (in points and polygons) in the Fill color selector, the transparency for the fill color in the Fill transparency selector, and the type of icon to use for points in the Point icon selector.
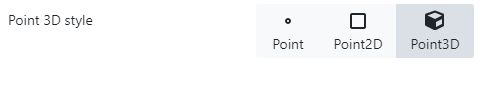
- The Modify style dialog in Street viewers has an extra option for vector layers, as it is shown below. Select a style for 3D points in the Point 3D Style selector. The options are:
- Point: points are rendered as simple billboards, usually with a given shape (a square) that is not altered with the Point icon selector and has no border.
- Point 2D: points are rendered as 2D icons drawn in a plane that is parallel to the ground. Here Point icon selector is used to set the shape of point and the point has a border drawn.
- Point 3D: points are rendered as 3D icons (using the equivalents to its 2D counterparts in the Point icon selector). The border color is ignored as has no sense in a 3D object.
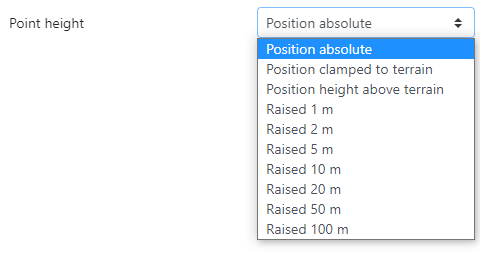
- The Modify style dialog in 3D viewers has a Point height selector as it is shown below. This selector has three options:
- Position absolute: This is the default value and it render points using the absolute height value contained in its coordinates. For points without Z value they will be rendered as if it are at zero absolute height.
- Position clampled to terrain: This option is useful for user vector data that do not adjusts exactly to current loaded terrain, as a way to avoid points from being occluded by terrain if the fall below it. Point absolute Z values are ignored and they are snapped to current terrain. Be aware that terrain can change in different locations of the globe if LiDAR or Mesh3D projects are loaded.
- Position height above terrain: This option is as the previous one but it uses the height Z values as relative heights from the ground. This is useful for user data that is known to be in relative heights from the ground and not in absolute coordinates.
- Raised 1m to 100m: This option is like Position absolute but raises the Z value by the selected value. This helps in visualize features that can be below the current 3D models loaded.
- The Modify style dialog in Street viewers has an extra option for vector layers, as it is shown below. Select a style for 3D points in the Point 3D Style selector. The options are:
-
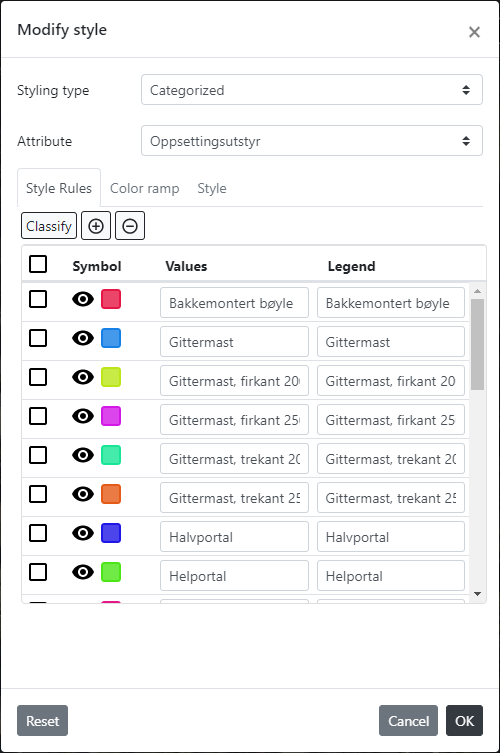
If the Styling type is Categorized select the attribute to use as category in the Attribute selector. To create a classification there are two options in the Style rules tab:
- Click the Clasify button to create an automatic classification. Existing classification will be replaced. Each different value in current features in the layer will be used to create one style rule, and also a default style rule called Other (for features that has a different value than any of the values in the list) and a default style rule called Unclassified (for features with null values).
- Click Add button to add a style rule to classification list and Remove button to remove the selected style rules. Then type the value of the attribute in Values textboxes and the text to show in Layer Switcher and other controls for the style rule.
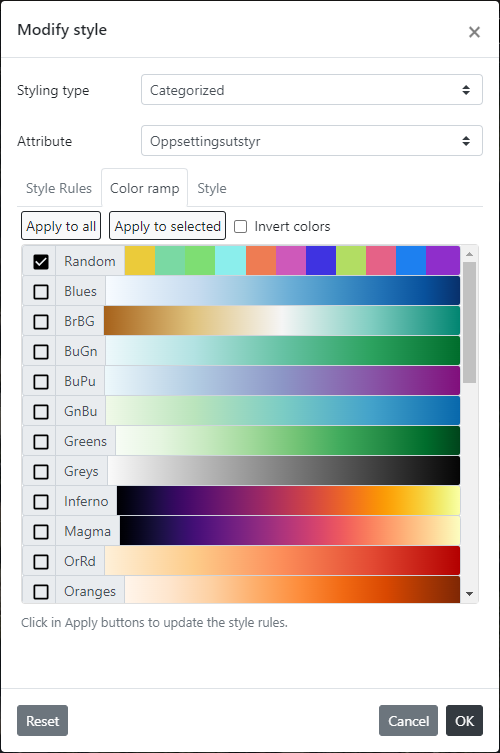
- To use a ramp color for the classification, in the Color ramp tab select the ramp color in the list and then click in Apply to all button to apply these colors to all the style rules, or Apply to selected button to apply the colors to selected style rules only. If you want to apply colors in the ramp in reverse mode check the Invert colors checkbox. Colors are only applied both to fill and stroke colors of features.
- To set individual properties for style rules, in the Style tab select the properties (Stroke width, Stroke color, Fill color, etc.) the same way it is done when Styling type is Single symbol, and then click in Apply to all button to apply these properties to all the style rules, or Apply to selected button to apply the colors to selected style rules only. Combining the use of Style tab options first and then the Color ramp tab you can create any kind of style for each style rule.
-
If the Styling type is Graduated select the attribute for the cloropleth classification in Attribute selector. Then select the classification mode in Mode selector and the number of classes. Then proceed as described in Categorized styling for creating the classification, add or remove classes, and set the style for each style rule. There are five classification modes:
- Equal interval: each style rule divides min and max values in equal size intervals.
- Quantile: each style rule divides the values with equal count number.
- Natural breaks: follows the generation of breaks in the Jenks algorithm that introduces less variation in each class.
- Standard Deviation: style rules are divided in classes that has similar difference in standard deviation.
- Pretty breaks: style rules are rounded to integer numbers.
-
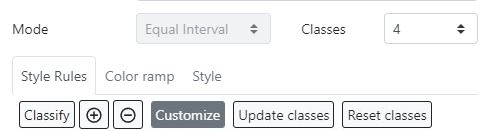
If the Styling type is Graduated and the layer styled is a user WFS layer, then there are some limitations in the attributes, modes and number of classes than can be selected. For example, the only mode allowed in Equal intervals. As all the information resides in the server, the calculations take time. For these layers several default classifications are created the first time the layers are created in the server, but these classifications can be changed. To change them follow these steps:
- If an attribute with limitations is selected three buttons will appear in the Graduated styling type: Customize, Update classes and Reset classes.
- The Customize is a switcher. Click in it to enter the customization mode. Click again to exit this mode. When in customization mode, the values in the classification can be edited. Otherwise they are disabled disabled. Also, the number of classes in customization mode is not limited. It is possible to classify with up to one hundred classes.
- Edit any of the values in the classification.
- Once the classification is edited, click in Update classes button. This will send the new classification to the server, that now will be the default one, and will retrieve the values and classes for it. Every time a new classification is set for an attribute, the number of classes that can be used is limited to the divisors of the total number of classes.
- To reset the current classification to the initial default one, click in the Reset classes button.
-
To reset to initial settings when dialog opened click in the Reset button.
-
To apply the settings click OK button.
Changes to style in vector layers are persisted in the workspace when the workspace is saved.
Change the style for raster layers
To change the style of a raster layer follow these steps:
-
Select the layer to change clicking in it on the layer list.
-
Click in the Edit style button.
-
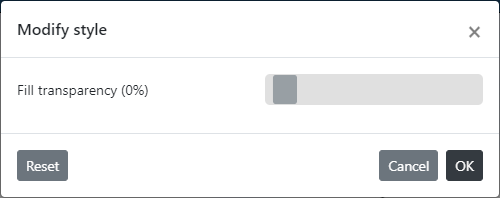
The Modify style dialog opens. For a raster layer the dialog has this appearence:
-
In this case the transparency of the layer is the only option.
-
To reset to initial settings when dialog opened click in the Reset button.
-
To apply the settings click OK button.
Changes to style in raster layers are persisted in the workspace when it is saved.
Change the style for LiDAR project layers
-
Select the layer to change clicking in it in the layer list.
-
Click in the Edit style button.
-
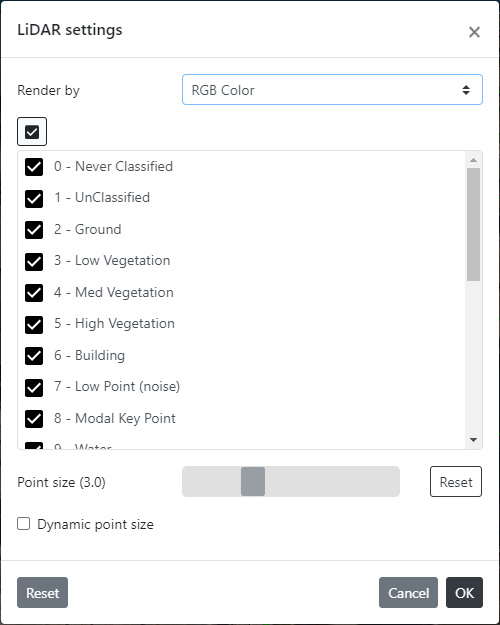
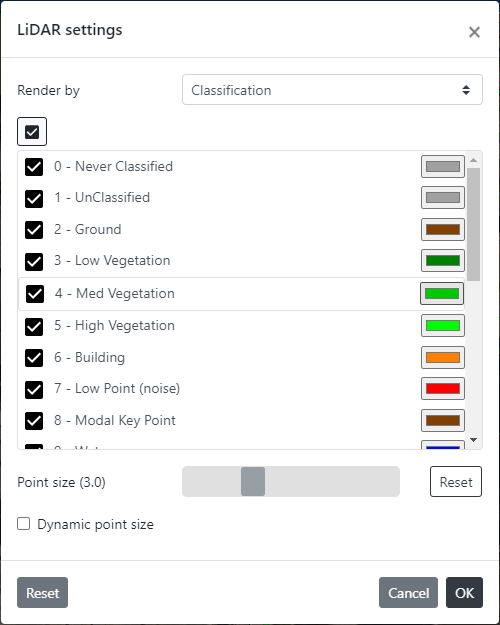
The LiDAR settings dialog opens. For a LiDAR project layer the dialog has this appearence:
-
Select a type of render for the layer in the Render by dropdown. The two types of render are:
- RGB color: this option renders the LiDAR data using the RGB values present in the points.
- Classification: this option renders the LiDAR data using the batch table present in the points. If no batch table is present then selecting this option has no effect and a message will be shown in the dialog indicating this.
-
When RGB color render option is selected the Classification listbox will appear as in the previous snapshot. The listbox will show any classification values present in the batch table, if any exists. If no batch table is present, then the listbox will be empy. You can check or uncheck any of the available classification values to show or hide classes from the render.
-
When Classification render option is selected the Classification listbox will appear as shown below. The listbox will show any classification values present in the batch table, if any exists. If no batch table is present, then the listbox will be empty. It also will show the default colors for each class. You can check or uncheck any of the available classification values to show or hide classes from the render. Also you can change any default color by click in the color buttons. Classes will be rendered will colors set.
-
Use the Point size slider to select a size for points or click in Reset to set the default value. There are some limitations in Cesium library that is used to render LiDAR data that avoid render points with different sizes when a batch table is used in classification.
-
Check or uncheck the Dynamic point size checkbox to ignore the previous Point size slider and make point sizes dynamically change depending on distance to viewpoint of the viewer.
-
To reset to initial settings when dialog opened click in the Reset button.
-
To apply the settings click OK button.
Changes to style in LiDAR project layers are persisted in the workspace when saved.
Change the visibility priority
To change the visibility priority follow these steps:
- Select a layer in the list clicking in the layer list.
- Click in the Move layer up button
 to increase the priority in the visibility.
 - Click in the Move layer down button
 to decrease the priority in the visibility.
These options are not available in Street viewers and 3D viewers because has no sense there. Layers are drawn using 3D coordinates and visibility priority is the same for all them.
Export a vector layer
There are two options available to export a vector layer to an external local file:
- using the Layer panel: that is described below.
- using the Feature panel. To check more info about exporting from Feature panel see Export layer.
The difference between them is that Layer panel tool executes a fast export without presenting any options to the user and using the Feature panel a dialog is shown to let the user define some options.
To export a vector layer to a local file from Layer panel follow these steps:
- Select the vector layer to export in the layer list.
- Click in the Export layer button.

- The data will be saved automatically in the 'Download' folder of the local machine. The output format will be a Zip file named features_EPSG_XXXX_YYYYMMDD_HHMM.zip containing the export in all supported formats (Kml, GeoJson and Shapefile), where XXXX is the EPSG code of the current output projection defined for the workspace and YYYYMMDD_HHMM is the current date & time.
Import a vector layer
There is an option that allows to import the content of an external local file to a giving layer (if the type of layer allows this importing action).
To import a vector layer existing in a local file from Layer panel follow these steps:
- Select the vector layer in which the vector data is wanted to be imported.
- Click in the Import into selected layer button.

- If the import action cannot be done in the selected layer a warning will appear.
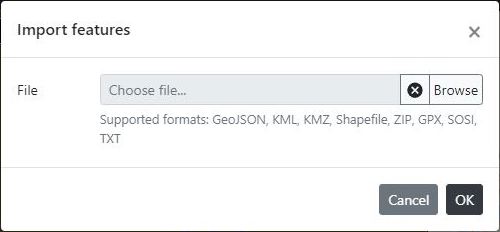
- The Import features dialog will appear. Click in Browse to select a file in the supported formats. Click OK to proceed.
- If importing to a layer that comes from a local file, then importing adds all features to existing ones in the layer. If importing to a user WFS layer, as these layer reside in the server and currently the data cannot be send to the server, the only thing is done is that any attribute not fixed (that is, any attribute that do not exists in the server) is added to features with same IDs. Although this action seems a bit limited for now in user WFS layers, it allows a kind-of local editing of WFS layers, because user can export a WFS layer with the customized data, and later reload that data at any other session by importing it.
Swipe layers in Global viewers
This option is only available in Global viewers, and not in Street viewers or 3D viewers. The option is useful to partially hide one layer without the need to hide and show it completely. It works the same no matter if the Global viewer is in Ortho or Oblique mode.
To toggle swiping of layers select any layer in the Global viewer and then click in the Set layer as swipe layer button. 
The button will remain selected anytime a Swipe layer is set. The swipe layer icon appears to the right of the layer name to highlight what layer is the swipe layer ![]() . There can be only one swipe layer per Global viewer. If a swipe layer is set and Set layer as swipe layer button is clicked then previous layer is unset as swipe layer and new layer is set.
. There can be only one swipe layer per Global viewer. If a swipe layer is set and Set layer as swipe layer button is clicked then previous layer is unset as swipe layer and new layer is set.
To unset the swipe layer click in Set layer as swipe layer button if the layer is selected and swiping capabilities will be removed.
When any layer is set as swipe layer a slider control will appear in a side of the viewer. Use that slider to change the width that the swipe layer will fill in the viewer. If the slider is on the left the layer will expand to all the viewer width, and if it is on the right side, the layer will be completely hidden.
Auto-hide baselayers in 3D viewers
This option is only available in 3D viewers and allows to automatically hide baselayers. This is useful when previewing LiDAR data on close zooms because baselayers tend to blend with LiDAR points and make it harder to view them.
To toggle the auto-hide of baselayer click in the Auto hide tile layers button. 
Other useful information about viewers: