Viewers
The workspace is composed of a set of viewers. Each viewer is a container in the layout that can be shown or hide and has its own settings.
Other useful information about viewers:
- Viewers navigation
- Toolbox
- Layer panel tools
- Layer panel layers
- Layer panel syncing
- Viewer shortcut bar
- Viewer status bar
- Viewer measurements and annotations
- Street panel
Types of viewers
The different data sources are displayed in six different viewer types: Map, Oblique, Street, 3D, Profile 3D and Attribute Table.
Map
This viewer shows geo-referenced data based on two different types of source layers:
- Raster images: Tiled images always downloaded from remote servers. This can be:
- Base layers: opaque raster sources on tile based Jpeg format. This information is provided through WMS/WMTS services. By default viewers are created with a base layer from Mapspace and from OpenStreetMap.
- Overlay layers: transparent raster sources on tile based Png format. This information is provided through WMTS services.
- Vector layers: Vector data loaded from local files or downloaded from remote servers provided by Mapspace or other external providers.
The accessing to the different available layers, areas and functionalities on Mapspace services is restricted. So, contact with your local Sales Support representative in order to configure your layers priority list.
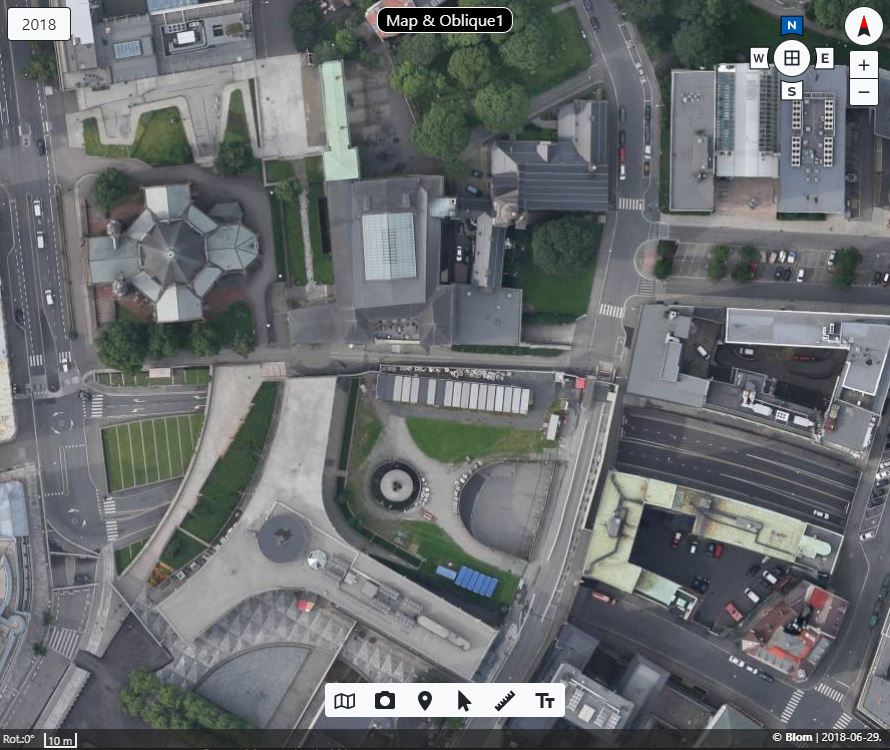
Obliques
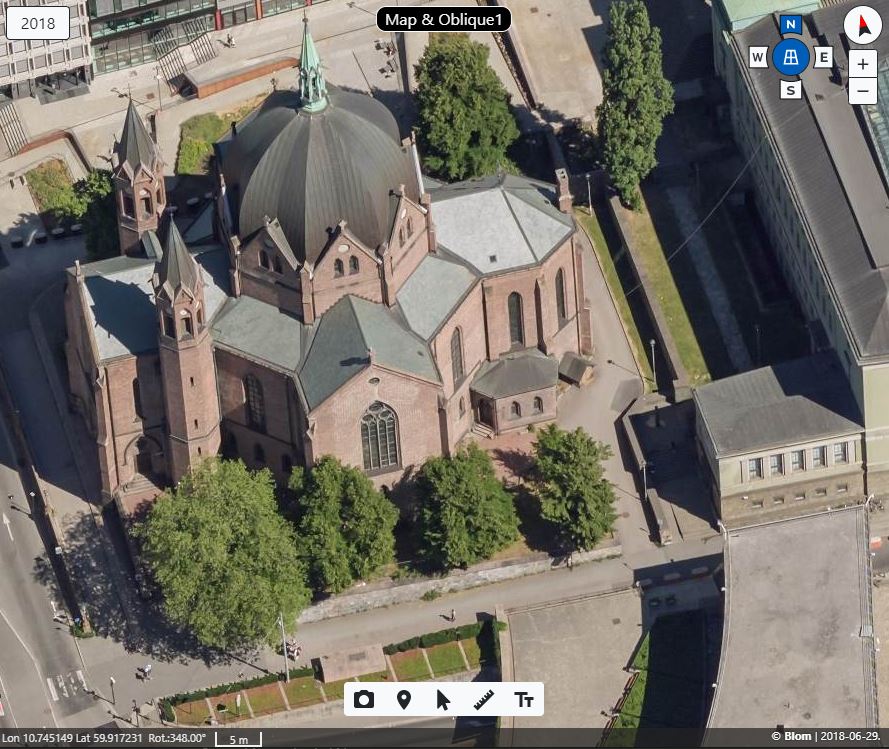
This type of viewers show Oblique aerial imagery. On top of the imagery it is possible to show vector data of the same type as in Map viewers.
Note: Currently Map viewers and Oblique viewers has been unified in one viewer: the Global viewer (also called Map & Oblique viewer). This viewer internally manages two viewers and the switch between both viewers is predefined based on the resolution of the zoom level and the availability of oblique images. The Global viewer also can be set up to work in Only Map mode and never switch to Oblique mode. See more on this in Map & Oblique rotator control.
Access to different available layers, areas and functionalities must be provided by the Mapspace Team. So, contact with your local Sales Support representative.
Street
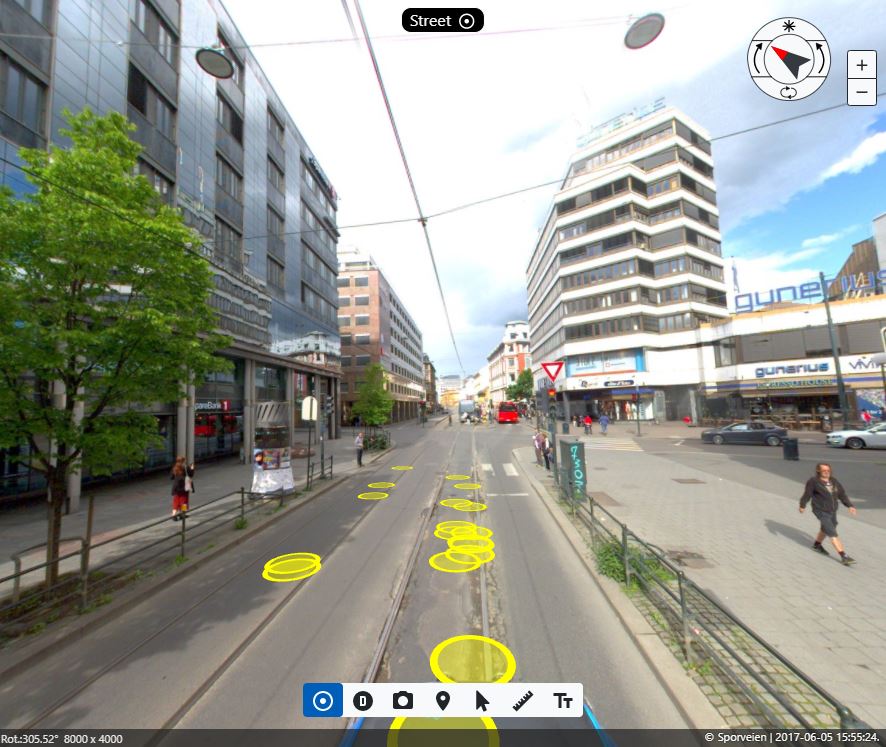
This viewer shows street panorama imagery. On top of the imagery it is possible to show vector data of the same type as in Map viewers.
Access to different available layers, areas and functionalities must be provided by the Mapspace Team. So, contact with your local Sales Support representative.
3D
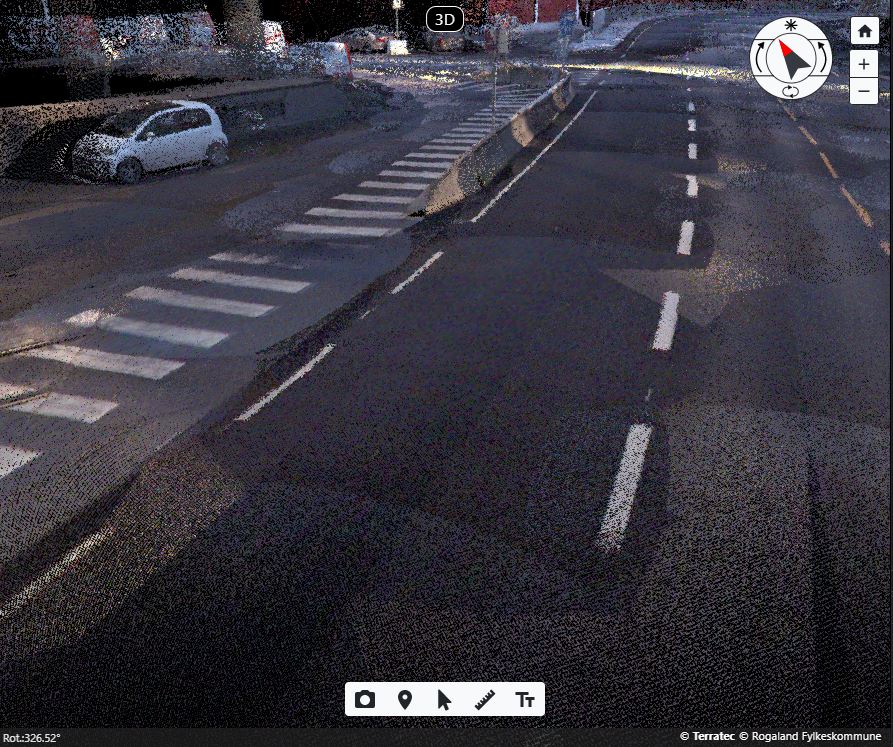
This viewer shows 3D data. It has the most complete support for different types of data sources. It can show the same data sources as in Map viewers (but shown in 3D coordinates) and also supports three types of extra data sources:
- Terrain data: DTM elevation meshes that are used to render the terrain of the world globe.
- LiDAR data: LiDAR projects.
- Mesh3D data: 3D meshes of cities.
All this three data sources are served from Mapspace servers in tiled formats based on standard formats.
The data is not downloaded as layers in the viewers but as projects. Projects are loaded when viewers is centered at a location where projects exists. The user then can control if the located projects must be rendered or not.
Access to different available layers, areas and functionalities must be provided by the Mapspace Team. So, contact with your local Sales Support representative.
Profile 3D
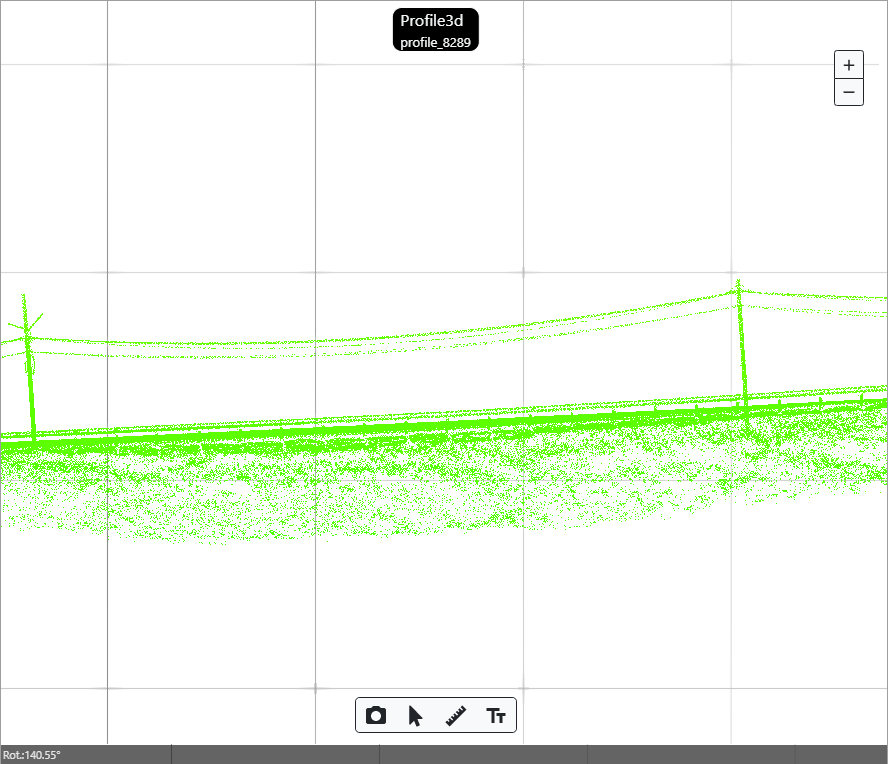
This viewer shows LiDAR data in profile style. This means we will se a section of the LiDAR data instead all available for a certain area. It allow user to isolate just the section of the LiDAR projects is interested in. The way to use this viewer is:
- Profile3d panel must be open to access the profile3d definition tool in global viewer.
- Profile3d definition tool allow user to define a profile area with just 3 clicks.
- Profile3d viewer will be automatically open to show LiDAR data for just created profile3d.
- Defined profiles3d are listed in the profile3d panel, allowing users to navigate throw them.
- Measurements, annotations and other tools are also available for this viewer.
Access to different available layers, areas and functionalities must be provided by the Mapspace Team. So, contact with your local Sales Support representative.
Attribute Table
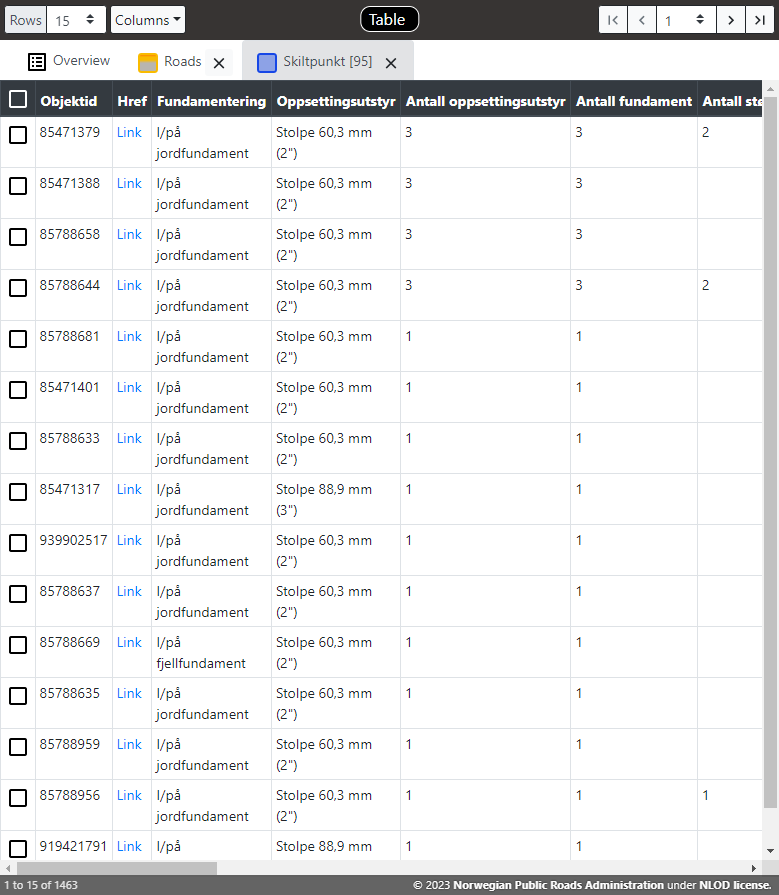
This viewer shows vector layers as tables. Each layer added is a tab in the viewer. If layers are moved up and down in the list of layers, the tabs are reorder accordingly. Also renders an Overview tab with a summary of the number of features in the layer using several statistics. The way to use this viewer is:
- Select the number of rows to see in each page in the Rows selector in the top header of the viewer. Also it is possible to select All to see all the rows in the table at once.
- Select the columns to be visible and the order of them in the Columns selector in the top header of the viewer.
- Navigate through the pages of the table using the Table navigator in the right of the top header of the viewer. When the maximum number of rows per page is changed the page index is set the the closest one to previous.
This tye of viewer is accesible to any type of user of Mapspace service.
Mapspace UserLayers
In order to provide a direct access to an specific data source with an special configuration (layer, date & extent), it is possible to create a UserLayer item linked to the Mapspace user profile.
The UserLayer definition is based on:
- Layer: Map, Oblique, Street or LiDAR data source layer
- Date Range: Data capture interval
- Extent: Geographic extension area
The UserLayer generation is handled by the Mapspace Team, so contact with your local Sales Support representative in order to request any action related with the UserLayers.
All available UserLayer's for an specific user are accessible through the Viewer Menu, Layers tab.